[See update below]
A new post on The Hockey Schtick reviews a new paper “that finds only about 3.75% [15 ppm] of the CO2 in the lower atmosphere is man-made from the burning of fossil fuels, and thus, the vast remainder of the 400 ppm atmospheric CO2 is from land-use changes and natural sources such as ocean outgassing and plant respiration.”
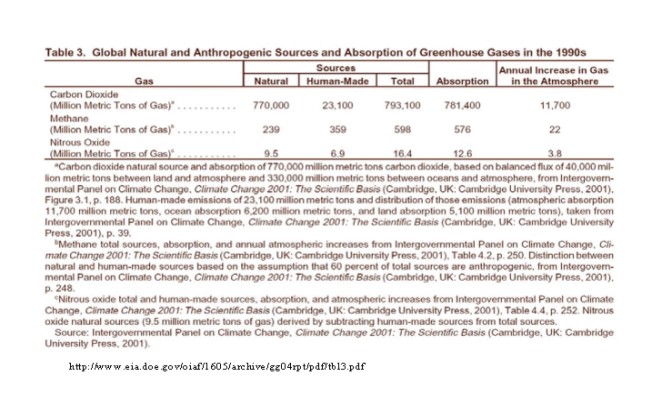
The contention made by HockeySchtick seems to be supported by old table from the Energy Information Administration which shows the same thing: only about 3% of atmospheric carbon dioxide is attributable to human sources. The numbers are from IPCC data.
Look at the table and do the arithmetic: 23,100/793,100 = 0.029.
URL for table: http://www.eia.doe.gov/oiaf/1605/archive/gg04rpt/pdf/tbl3.pdf
If one wanted to make fun of the alleged consensus of “climate scientists”, one could say that 97% of carbon dioxide molecules agree that global warming results from natural causes.
[UPDATE: Since I first made this post, Hockey Schtick has taken down their post due to pressure from the referenced paper’s authors. However, the chart shown above is still valid and supports the claim that only 3% of atmospheric CO2 comes from human sources. HockeySchtick will repost once it gets some answers from the author. Meanwhile, my post was submitted to and published by Anthony Watts’ WUWT blog and has received many comments. I apparently made the same mistake as on the Hockey Schtick: I took what the original paper’s author wrote, to be was she meant. There appears to be some misunderstanding between atmospheric concentration of CO2 and flux of sources and sinks for CO2. The WUWT article is here:
http://wattsupwiththat.com/2014/07/29/epa-document-supports-3-of-atmospheric-carbon-dioxide-is-attributable-to-human-sources/]

A reply from the authors of the scientific article on the “review” on The Hockey Schtick blog has pointed out that the results cited are grossly misinterpreted and the blog has taken down the entire review and following comments.
The fact remains, however, that early IPCC data show that only 3% of CO2 in the atmosphere is due to humans.
That would be if you are looking at only gross fluxes going in the atmosphere. If you account what goes in and comes out and what stays in (also shown in the table linked above) you might want to correct that calculation.
I don’t understand your comment. What else but gross fluxes is worth looking at?
I see that you are lead author for the paper reviewed by HockeySchtick. From your abstract is this sentence:
“We find that the average gradients of fossil fuel CO2 in the lower 1200 m of the atmosphere are close to 15 ppm at a 12 km × 12 km horizontal resolution.”
Does that not mean that the fossil fuel component represents 3.75% of the total atmospheric CO2?
No, it does not. Since my reply to the hockey schtick is not visible now that they have taken down the entire review I will repost it here (it was a bit long, for which I apologise):
“As the lead author in the cited scientific article ( http://www.atmos-chem-phys.net/14/7273/2014/ ), I would like to address several key points of our study, which I believe were misunderstood by the author of this blog entry and are misleading the readers.
(1) The paper does not state that (quote from the blog) “only ~3.75% of atmospheric CO2 is man-made from burning of fossil fuels”, this thought was constructed by the blog-writer and conclusions drawn from it are entirely his/her own.
(2) The paper does not state that (quote from the blog) “only 15 ppm or ~11.5% of the increase (in CO2 since pre-industrial times) is of fossil fuel origin”. This again is a creation by the blog-writer.
As it is quite challenging to untangle the information extracted from our article and the conclusions, which the author of this blog is drawing from it, I hope for your patience in reading this undoubtedly long reply.
It might be easiest to point out first that the cited sentence („We find that the average gradients… “) from our abstract, which is possibly the centerpiece in this blog entry, is preceded in the article by several sentences explaining the temporal and spatial scope of our study – 6 summertime months in 2008 over Western Europe.
This explanation should already address the misconception that the cited 15 ppm of fossil fuel CO2 are the global average concentrations and cover the historical period since the pre-industrial era. Rather the opposite, those are the gradients in the newly added fossil fuel CO2 concentrations in Western Europe within the 6 month period covered in our study.
If you read the research article carefully, you will find that the phrase used in both title and front-running paragraph of this blog entry (“only ~3.75% of atmospheric CO2 is man-made from burning of fossil fuels”) is nowhere to be found in our article. That is because we aim at evaluating only the recently added anthropogenic CO2 to the atmosphere in a particular region of the world.
All the older (previously added, both anthropogenic and natural) CO2 as well as the CO2 being added during the 6 months of our study but outside of our region are included in the term ‘background CO2’ in our study. This crucial point might have been overlooked by the author here as we are using terminology and methods from previously published research (with provided references) that he/she might have not looked into. It is common and good practice in our field to use previously defined terminology.”
With regard to your gross fluxes question – imagine the atmosphere (as a reservoir of CO2) as a pool. You have several pipes that control the in/out flow. You have this huge pipe of biospheric inflow, almost as big as the pipe for the biospheric outflow. You have silimar pipes for the ocean inflow and outflow in the pool. Regardless of the actual size of the big pipes – they are relatively balanced between inflow and outflow – their net contribution to the pool is almost zero when compared to the gross fluxes themselves – in some years the pool level is rising, in other it is going down.
Now you add a much smaller pipe for the inflow from anthropogenic emissions. This pipe does not have outflow to balance it, so it’s net contribution is in fact the entire inflow of it to the pool. And the net contribution of this pipe is in fact bigger than the net contribution of the other huge pipes and is growing. Luckily the outflow pipes to the biosphere and ocean are in fact a bit bigger (or you could say flexible) and manage to take up a bit of the inflow from the anthropogenic flux. Still, the pool is getting filled up faster and faster.
Denica,
Below on your longer explanation you state that the AGW portion of CO2 has no outlet.
I think you are incorrect.
Please review this article from the greenhouse industry.
It states that as long as CO2 up to 1500ppm and sunlight are both present, plants will uptake whatever is available (manmade or natural, since they don’t discriminate between CO2 molecules of different origin).
http://www.novabiomatique.com/hydroponics-systems/plant-555-gardening-with-co2-explained.cfm
It seems to me that we could double atmospheric CO2 today and the plants on this planet would drink more deeply and grow faster, sequestering carbon as they go. Frankly, this effect alone would, if properly and honestly modeled, present a natural and powerful carbon sink that would preclude any significant rise in CO2 on any timescale.
Note also the safety limits for CO2 concentrations in greenhouses. That is also a simple common sense way to understand we have a loooooong way to go before CO2 could become an issue.
Thank you for the explanation. I especially liked the “pipe” analogy. There are many confounding factors, however. In a warming world I would expect the oceans to be a net source rather than a sink because of the temperature dependency of carbon dioxide solubility.
Your abstract mentions regional gradients which can be different from global gradients. Besides seasonal variation in CO2, there can, as you point out, be local differences in CO2 atmospheric content due to population centers, volcanic eruptions, CO2-rich hot spring emissions, forest fires etc. These are other “smaller pipes.” You also did not mention whether the 15ppm gradient was positive or negative, but the contextual assumption for readers is that it was positive.
I disagree with the statement: “Now you add a much smaller pipe for the inflow from anthropogenic emissions. This pipe does not have outflow to balance it, so it’s net contribution is in fact the entire inflow of it to the pool.” With the increasing concentration of CO2 in the atmosphere we have seen a “greening” of the earth with more robust plant growth. This fertilization effect partially balances the anthropogenic emissions (and increased ex-solution from oceans) as would increased rates of weathering of rocks. Nature is complicated.
Could someone explain how the nuclear industry enriches C-14?
Check this page, it shows both natural and artificial production of C14:
http://c14.arch.ox.ac.uk/embed.php?File=sources.html
Denica, what background concentration did you find for 14CO2 and how does it compare to preindustrial 14CO2? That is the important question.
Fergus,
In my study we prescribe the signature (expressed in capital delta notation) of 14CO2 for the background atmospheric CO2 from the one in observations in background sites (my particular study uses the data from the high alpine observatory of Jungfraujoch). The comparison with the preindustrial 14CO2, however, will give you very little information – in the linked page provided by wryheat2 in the post above you can get more information about 14CO2 in the atmosphere – but basically in the 50s and 60s the atmospheric nuclear bomb tests doubled the amount of 14CO2 in the atmosphere and this enrichment was later transfered to the biosphere and ocean, which even now feed back with some enriched in 14CO2 carbon back to the atmosphere. So simple comparison of before and after is not really possible, since there is a different major factor that contributed change in the same period.
In my study we use 14CO2 signatures relative to other stations to estimate the relative enrichment or depletion – and thus the gradient between locations.
P.S. I am sorry for the delay in answers, I am on a quite different time zone 😉
So when the article mentions enrichment of C-14 from the “nuclear industry” it is really referring to “atmospheric testing of nuclear weapons” not commercial power generation. Please use accurate, generally accepted terms. Nuclear industry refers to commercial power generation. It has nothing to do with nuclear weapons testing.
In our article, in fact, we refer exactly to the production of 14C from nuclear power plants and spent fuel reprocessing plants. On a relative scale though, the contribution of the nuclear industry is more recent, small in magnitude and prolong in emissions, compared to the bomb tests in the 50s and 60s. The question was refering to the use of 14C to compare “now” and “pre-industrial”. In this time scale, I would say the bomb spike is much bigger influence.
Thank you for clarifying. The reaction in nuclear reactor would be with oxygen (in the fuel and the coolant) not with nitrogen as in the atmosphere.
As far as I remember there are reactions with all 14N, 17O and 13C and depending on the reactor type or the part of the production process the dominant reaction might change. I believe I have seen more information about it in this article –
Man-Sung Yim, François Caron, Life cycle and management of carbon-14 from nuclear power generation, Progress in Nuclear Energy, Volume 48, Issue 1, January 2006, Pages 2-36, ISSN 0149-1970, http://dx.doi.org/10.1016/j.pnucene.2005.04.002.
Thank you, that article would make an interesting read. If you have a condensed version, I would be interested.
I, too, would be interested in reading the whole paper.
I believe one of the authors have made it available for download on the ResearchGate: https://www.researchgate.net/publication/222817513_Life_cycle_and_management_of_carbon-14_from_nuclear_power_generation
Figure 1 in the paper shows that the 12x12km grid total area is a good chunk of Europe. It is centred on Netherlands and includes all of Belgium, Germany, Luxembourg, and most of Switzerland. It also includes almost all of Denmark nd about half of the UK, France, Austria and Czech Republic. Small portions of Finland, Poland and Italy make up the rest. This portion of Europe has much industry.
Industry there has a greater effect than Nuclear. Where there is no industry and no nuclear power plants like the ocean, then the amount of CO2 with C14 should be a bit higher which means the 15ppm should be reduced. Using the 15 ppm as a global average is a worst case scenario.
As CO2 is well mixed in the atmosphere, that 15 should be compared to the 385ppm or so from 2008 which gives 3.9%
The measured increase in chlorophyl in recent years suggests that the outflow has increased. The pipe analogy is inappropriate.
sorry. I missed the first paragraph
So, they looked at the amount of CO2 molecules that have carbon 14. Near where fossil fuel is burnt, there will be less C14. Near Nuclear Plants, there will be more C14. The average is 15 ppm for the study area. The Hockey Schtick erroneously compared that to the current 400 ppm which gave the 3.75%. The data are from 2008 for a small area of the Northern Hemisphere for only 6 summer months.
Figure 1 in the paper shows that the 12x12km grid total area is a good chunk of Europe. It is centred on Netherlands and includes all of Belgium, Germany, Luxembourg, and most of Switzerland. It also includes almost all of Denmark nd about half of the UK, France, Austria and Czech Republic. Small portions of Finland, Poland and Italy make up the rest. This portion of Europe has much industry.
Industry there has a greater effect than Nuclear. Where there is no industry and no nuclear power plants like the ocean, then the amount of CO2 with C14 should be a bit higher which means the 15ppm should be reduced. Using the 15 ppm as a global average is a worst case scenario.
As CO2 is well mixed in the atmosphere, that 15 should be compared to the 385ppm or so from 2008 which gives 3.9%
The measured increase in chlorophyl in recent years suggests that the outflow has increased. The pipe analogy is inappropriate.
“The average is 15 ppm for the study area.”
This is already an incorrect statement. The cited number of 15 ppm is of gradient in the concentrations of recently added fossil fuel CO2 in our study area. Basically, the difference between the least “polluted” and most “polluted” regions. And as such, the following extrapolation how this would be translated to oceans and further to the global scale in my opinion is not based on actual calculation, but speculation. Our study was not designed for such purpose and I seriously doubt it actually can provide the information require to make any scientific estimate.
“As CO2 is well mixed in the atmosphere, that 15 should be compared to the 385ppm or so from 2008 which gives 3.9%”
Again, I would like to point out that even if the cited number was not the gradient, but the average concentrations (as the original “review” of our article suggested) – this is still only the recently added fossil fuel for the 6 months in the area that we have simulated. And as such comparing it to the globally averaged total CO2 concentrations only gives you some kind of ratio for the fraction of the CO2 that is recently added in this region.
“The measured increase in chlorophyl in recent years suggests that the outflow has increased. The pipe analogy is inappropriate.”
I wish people that started reading the pool analogy actually paid attention to this part as well
“Luckily the outflow pipes to the biosphere and ocean are in fact a bit bigger (or you could say flexible) and manage to take up a bit of the inflow from the anthropogenic flux. Still, the pool is getting filled up faster and faster.”
I do acknowledge that the biosphere and ocean uptake are compensating partially for the new inflow. That does not change the fact that the system now has a new factor and is not in balance anymore, which is visible by the continuous increase in the concentrations globally in atmospheric CO2 and oceanic surface pCO2.
Am I the only one who caught this? Dr. Bozhinova gave the pipe analogy:
“Now you add a much smaller pipe for the inflow from anthropogenic emissions. This pipe does not have outflow to balance it, so it’s net contribution is in fact the entire inflow of it to the pool. And the net contribution of this pipe is in fact bigger than the net contribution of the other huge pipes and is growing.”
I understand that to mean that it is, in fact, a very small percentage of total CO2 but the argument is that it cannot be absorbed and has a greater effect relative to its actual volume.
1) This acknowledges that the ratio of man-made to natural CO2 is low.
2) The argument is highly problematic. The “outflow” mechanisms are not well understood and the planet has a long history of large variability in CO2 fluxes. Furthermore, there is an awful lot of “estimating” going on with CO2 fluxes and everything else in climate change research. “Estimating” is also known as guessing and assuming.
1) No one has ever questioned the idea that as a percentage of yearly emissions man’s contribution is low.
2) BUT, the earth absorbs CO2 whereas man does not. In fact the Earth absorbs all it emits plus about half of what man emits. That means the left over CO2 that increases the total concentration of CO2 in the atmosphere is all down to man’s contribution. that ratio have remained relatively the same since we began measuring atmospheric CO2 directly in 1958. There is nothing problematic about it.
Denica Bozhinova writes: “…we are using terminology and methods from previously published research (with provided references) that he/she might have not looked into. It is common and good practice in our field to use previously defined terminology.”
That should go without saying. That it need be said says much.
Meanwhile ulidech writes: “Please use accurate, generally accepted terms. ”
LOL
Yes, scientists should write scientific papers using terms you – a non-scientist – should understand. Gavagai! It cannot be your fault for failing to take the relevant courses, reading the paper in question, and the referenced papers. Blimey, that would require effort and education.
As Denica will come to learn, quote-mining means you can ignore the caveats, nuance, and references. ClimateBall is a game of misdirection and the more ignorant one is on a subject the better the plausible deniability when eventually called on it.
A couple of things to keep in mind. 14C starts out as a small fraction of total C as it is produced mostly by cosmic and other radiation. 14C is radioactive so it decomposes over time. Volcanoes put out CO2 essentially free of 14C just as burning fossil fuels does as volcanoes are consuming carbonates just as the natural process of producing crude oil converts carbonates to crude oil. Since forests both grow and decompose back to CO2, only creation of inorganic forms of carbon like carbonates actually sequester C and cause a long term reduction in CO2. Carbonates are produced by plankton that deposit limestone and marble (calcium carbonate) on the bottom of the sea. From there it can be sub ducted to form natural gas and crude oil or be released by the heat of volcanoes as CO2.
It appears an unspoken fact is that there are at least two pools. One from which human CO2 is pulled, and one into which human CO2 is pushed. The implication is only humans have access to their exclusive pool. I think when the details of that pool are spilt some numbers will change. The humans-only pool includes carbon sources that are effectively isolated from the surface of the Earth, and carbon sources that are available to the surface of the Earth by other natural processes. Specifically, firewood and cow dung, which would naturally decay if left to nature, and petroleum found 5 miles below the surface that would be unlikely to ever enter the environment without human activity. So I wonder how much of our contribution includes burning cow dung. It really should be zero.
To Denica,
First, thanks for sticking with this thread.
Second, many of us do not have access to the full paper, only the abstract, so we may be unfamiliar with academic terminology.
Third: Too many papers are written in jargon only a few people understand. It would be of greater service to write so that any reasonably intelligent person could understand what you are saying regardless of field of study. This goes especially to studies funded by public money, which, in my opinion should be available to the interested public for free.
As far as I know, and correct me if I am wrong, the journal that the article is published in is open-access journal, so it should be available free of charge, not only the subscribed academic audience, but to anyone interested.
With regard to the terminology.. Unfortunately, I don’t believe that this is something that can be changed. Different scientific fields require their own terminology because they deal with different problems and specific terms save time for explanation. Some fields might require 16 different words for snow, other are fine with only one.
Communicating scientific results to the general audience is a gigantic feat that is quite difficult for most scientists, even though more and more effort is made in that direction. Writing a review for the general public of a scientific article is also quite difficult task as the person writing should understand both sides and be able to accurately translate the complexity of the science in terms that are understood but also accurate. I am afraid that is exactly what did not happen with the review my article had on the Hockey Schtick, as the writer himself was not familiar entirely with the subject he was reviewing.