Natural variation trumps CO2
Many climate scientists claim that our carbon dioxide emissions are the principal driver of global warming. I have asked several University of Arizona professors, who make such a claim, to provide supporting physical evidence. So far, none have been able to justify the claim with physical evidence.
In this article, we will examine the Earth’s temperature and the carbon dioxide (CO2) content of the atmosphere at several time scales to see if there is any relationship. I stipulate that the greenhouse effect does exist. I maintain, however, that the ability of CO2 emissions to cause global warming is tiny and overwhelmed by natural forces. The main effect of our “greenhouse” is to slow cooling.
There is an axiom in science which says: “correlation does not prove causation.” Correlation, however, is very suggestive of a relationship. Conversely, lack of correlation proves that there is no cause-and-effect relationship.
Phanerozoic time – the past 500 million years:
Estimates of global temperature and atmospheric CO2 content based on geological and isotope evidence show little correlation between the two. Earth experienced a major ice age in the Ordovician Period when atmospheric CO2 was 4,000ppm, 10 times higher than now. Temperatures during the Cretaceous Period were rising and steamy, but atmospheric CO2 was declining.
Notice also, that for most of the time, Earth’s temperature was much warmer than now and life flourished. There were some major extinction periods, all associated with ice ages.
Sources:
Berner, R.A. and Kothavala, Z, 2001, GEOCARB III: A Revised Model of Atmospheric CO2 over Phanerozoic Time, American Journal of Science, Vol. 301, February, 2001, P. 182–204
Scotese, C.R., http://www.geocraft.com/WVFossils/Carboniferous_climate.html
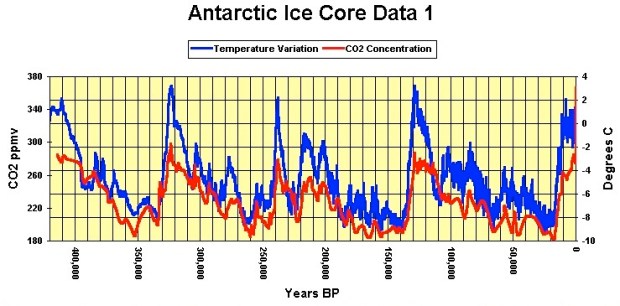
Our current ice age – the past 420,000 years:
During the latter part of our current ice age, glacial-interglacial cycles occurred with a periodicity of about 100,000 years which correlates with the changes in Earth’s orbit around the sun as it changes from nearly circular to elliptical with an eccentricity of about 9%. Here we see an apparent correlation between temperature and CO2. The data are from ice cores collected at the Vostok station in Antarctica. The scientists working on the Vostok core noticed that temperature changes PRECEDED changes in CO2 concentration by about 800 years. Again, we see that CO2 doesn’t have much influence on temperature, but temperature has great influence on CO2concentration because temperature controls CO2 solubility in the ocean.
Sources:
Petit, J.R., et al., 1999. Climate and atmospheric history of the past 420,000 years from the Vostok ice core, Antarctica. Nature 399: 429-436.
Mudelsee, M, 2001. The phase relations among atmospheric CO2 content, temperature and global ice volume over the past 420 ka, Quaternary Science Reviews 20:583-589.
Siegenthaler, U. Et al., 2005. Stable carbon cycle-climate relationship during the late Pleistocene. Science 310: 1313-1317.
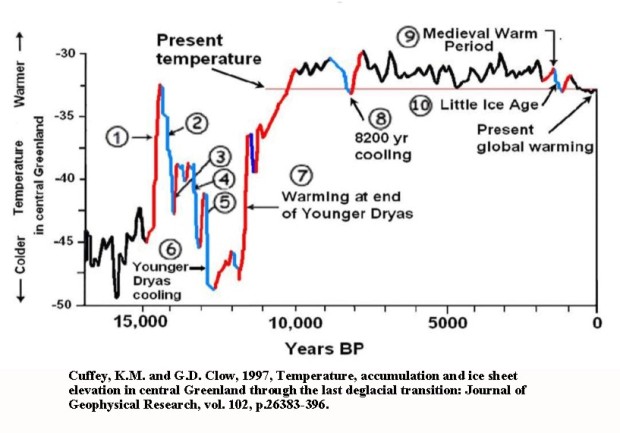
The Holocene – the past 10,000 years:
The Holocene represents the current interglacial period. For most of the past 10,000 years, temperature was higher than now. CO2 was fairly steady below 300ppm (vs over 400ppm now). There were cycles of warm and cool periods at a periodicity of 1200 to 1500 years. This periodicity correlates with the interplay of the several solar cycles. The sun itself goes through cycles of solar intensity and magnetic flux. When the cycles are in a strong phase, the amount of cosmic rays entering the atmosphere is reduced, there are fewer clouds to block the sun, so it is warmer. When solar cycles wane, as is beginning to happen now, more cosmic rays enter the atmosphere and produce more clouds which block the sun, so it becomes cooler. The number of sunspots (hence magnetic flux) varies on an average cycle of 11 years. There are also 87-year (Gliessberg) and 210-year (DeVriess-Suess) cycles in the amplitude of the 11-year sunspot cycle which combine to form an approximately 1,500-year cycle of warming and cooling.
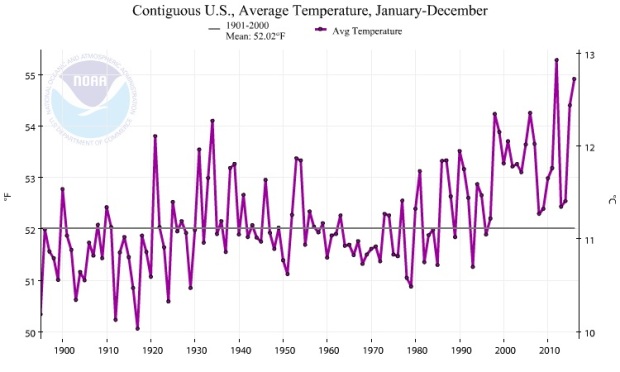
The 20th Century:
The first part of the 20th Century experienced warming in the 1920s and 1930s comparable to current temperatures. According to NASA, atmospheric CO2 rose from 295ppm in 1900 to 311ppm in 1940. Major emissions from burning fossil fuels, however, commenced after WWII in the mid 1940s. The period 1940-1970 saw a CO2 rise of 311ppm to 325ppm. That period also showed global cooling to such an extent that climate scientists were predicting a return to glacial conditions. From about 1980 to 2000, CO2 rose from 339ppm to 370ppm and we had warming during that period until the super El Nino of 1997/1998. Some of this data has been “corrected” by NOAA.
Source: NOAA Climate at a glance
The 21st Century so far
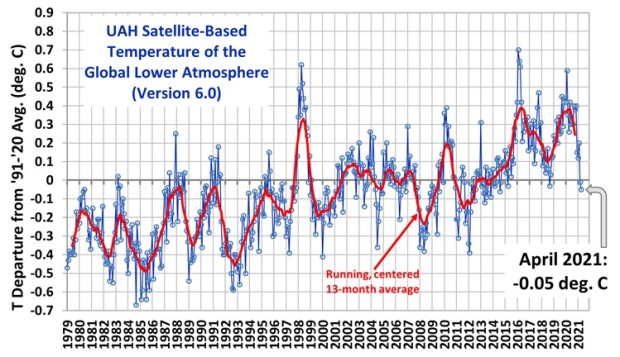
Microwave data from satellites converted to temperature.

Between the El Nino of 1997 and that of 2016, there have been temperature fluctuations but no net warming. Atmospheric CO2 rose from 363ppm to 407ppm today. It seems that there is no correlation between global temperature and CO2.
As I said at the beginning, while the CO2-induced greenhouse effect has some hypothetical warming potential, that warming is tiny and overwhelmed by the forces of natural variation. So far, I have seen no physical evidence to contradict my contention.
Source : http://www.drroyspencer.com/2017/05/uah-global-temperature-update-for-april-2017-0-27-deg-c/
See also: Evidence that CO2 emissions do not intensify the greenhouse effect


Jon; excellent summary. The only suggestions for improvement I can make is that you, (1) supply references for your figures, and (2) specify whether the recent data graphed has been “corrected” by the global warming establishment or whether the graphs are based on “raw data.”
Pete Dohms
References added. NOAA data is “corrected” surface temperature data. Satellite data is converted from microwave readings to temperature.