hurricanes

Hurricane strength and frequency just part of natural variation

The several recent hurricanes making landfall in the southeastern U.S. have spawned claims that they are the result of global warming. However, real data show that these hurricanes are consistent with natural variation. The following graphs were constructed by meteorologist Dr. Ryan N. Maue, who has recently been appointed as chief scientist at NOAA, the National Oceanic and Atmospheric Administration. See his website: http://climatlas.com/tropical/

Hurricane Frequency

On the graph below, the upper line shows all hurricanes with wind speeds of greater than 64 knots. The bottom line show major hurricanes with wind speeds of greater than 96 knots. As you can see, overall, there has been no increase in frequency.

Hurricane Strength

Hurricane strength is measured as “accumulated cyclone energy” ACE. In the graph below, the upper line is global, the bottom line is for the northern hemisphere.


Dr. Maue notes:

“Tropical cyclone accumulated cyclone energy (ACE) has exhibited strikingly large global interannual variability during the past 40-years. In the pentad since 2006, Northern Hemisphere and global tropical cyclone ACE has decreased dramatically to the lowest levels since the late 1970s. Additionally, the frequency of tropical cyclones has reached a historical low. Here evidence is presented demonstrating that considerable variability in tropical cyclone ACE is associated with the evolution of the character of observed large-scale climate mechanisms including the El Nino Southern Oscillation and Pacific Decadal Oscillation. In contrast to record quiet North Pacific tropical cyclone activity in 2010, the North Atlantic basin remained very active by contributing almost one-third of the overall calendar year global ACE.”

Hurricane landfalls:

The graph below shows the number of land-falling hurricanes since 1970. The dark bars are category 1&2 hurricanes; the grey bars are hurricanes of category 3 and above.


See also:

Why Hurricanes Can’t Be Blamed On Global Warming

A Review of the state of Climate Science    See why reducing carbon dioxide emissions from burning fossil fuels will have no effect on global temperature.


Florida Major Hurricane Strikes: No Significant Increase in Intensity from Sea Surface Warming

September 4th, 2019 by Roy W. Spencer, Ph. D.

Summary: Twenty-two major hurricanes have struck the east coast of Florida (including the Keys) since 1871. It is shown that the observed increase in intensity of these storms at landfall due to SST warming over the years has been a statistically insignificant 0.43 knots per decade (0.5 mph per decade). Thus, there has been no observed increase in landfalling east coast Florida major hurricane strength with warming.

Read more at Dr. Spencer’s blog here.


Why Hurricanes Can’t Be Blamed On Global Warming

The leftish press and Hollywood climate experts have been claiming that the recent rash of dangerous hurricanes is due to global warming. Dr. Roy Spencer, U.S. Science Team leader for the Advanced Microwave Scanning Radiometer flying on NASA’s Aqua satellite, takes exception to these claims in a short blog post and in a new E-bookavailable from Amazon for $2.99. The E-book is about 11,000 words long and contains 17 illustrations. I recommend you read it.

In the book, Spencer explains the origin of hurricanes and gives a history of U.S. hurricanes from colonial times to present time, including comments on hurricanes Harvey and Irma.

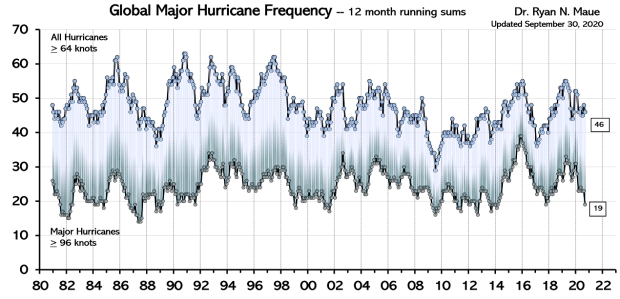
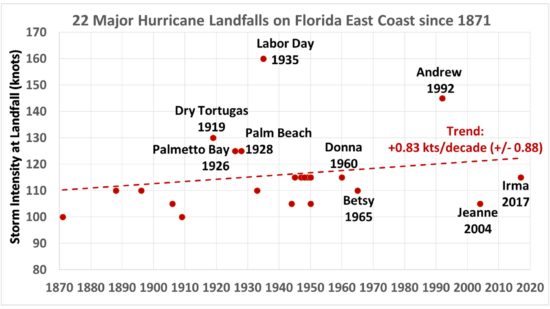
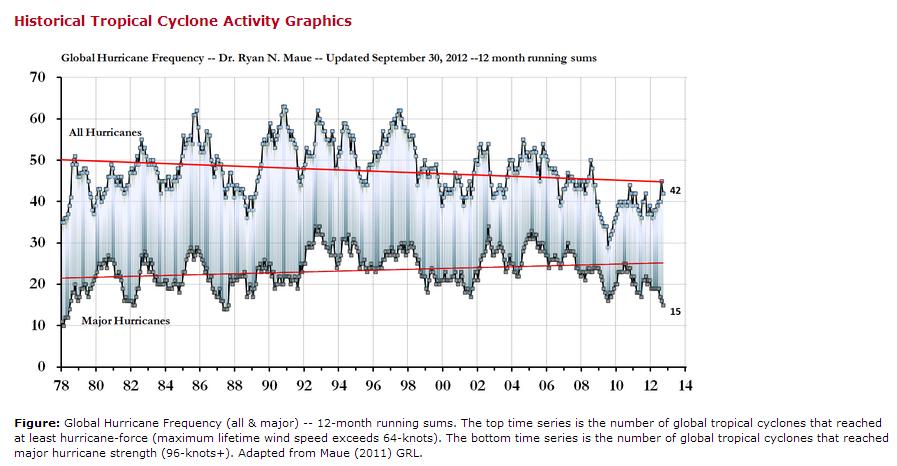
Spencer notes that geological studies of sediments in coastal lakes in Texas and Florida show that “catastrophic hurricane strikes were more frequent 1,000 to 2,000 years ago than in the most recent 1,000 years.” Hurricanes making landfall in Florida show a downward trend in both number and intensity (that trend includes hurricane Irma). Spencer says that hurricanes in tropical Atlantic, Caribbean, and Gulf of Mexico are not limited by sea surface temperatures.

He also notes that “ two major hurricane strikes endured by the Massachusetts Bay Colony, in 1635 and in 1675, have yet to be rivaled in more modern times.”

“…Most Atlantic hurricanes can be traced back to African easterly waves [of low wind shear].  These waves draw their energy from the temperature contrast between the hot air over the Sahara Desert and the cooler air over the Sahel, and as they leave the west coast of Africa they ‘kick start’ the organization of rain shower activity over the tropical eastern Atlantic Ocean.”

You will have to read the E-book to delve more deeply into the mechanics of hurricanes. Here is an excerpt:

If you were to go up inside the eye at the altitude where jets fly, you would find the air temperature there is 10 or 20 deg. F warmer than normal for that altitude. This warmth is caused by air being forced to sink in response to rising air in the showers and thunderstorms surrounding the eye. This ‘subsidence warming’ is a universal feature of all precipitation systems, but only in hurricanes is it highly concentrated into one relatively small area. All of the warm rising air in billowing rain clouds must be exactly matched by sinking air elsewhere, and in the case of hurricanes, that sinking air is most concentrated and intense in the eye of the storm.  For more common rain systems, the warming is much weaker as it is spread over huge areas hundreds or even thousands of miles in diameter. Only a few miles away from the eye is the heavily raining eyewall of the hurricane; this is where the strongest surface winds occur.

Spencer also has a chapter on “The Effect of Sea Level Rise on Hurricane Storm Surge” in which he shows that sea level rise has been mostly if not entirely natural, with no convincing evidence that it has accelerated from human-caused global warming.

Separate from Spencer’s data, Dr. Chris Landsea of NOAA Hurricane Research Division presents at table of Atlantic hurricanes beginning from 1851. You will see that there is no sign of influence by global warming. Landsea has this caveat about the data: “The Atlantic hurricane database (or HURDAT) extends back to 1851. However, because tropical storms and hurricanes spend much of their lifetime over the open ocean – some never hitting land – many systems were “missed” during the late 19th and early 20th Centuries (Vecchi and Knutson 2008). Starting in 1944, systematic aircraft reconnaissance was commenced for monitoring both tropical cyclones and disturbances that had the potential to develop into tropical storms and hurricanes. This did provide much improved monitoring, but still about half of the Atlantic basin was not covered (Sheets 1990). Beginning in 1966, daily satellite imagery became available at the National Hurricane Center, and thus statistics from this time forward are most complete (McAdie et al. 2009).” See data

Back in 1999, Landsea et al. published a paper which found “that multidecadal variability is more characteristic of the region. Various environmental factors including Caribbean sea level pressures and 200mb zonal winds, the stratospheric Quasi-Biennial Oscillation, the El Niño-Southern Oscillation, African West Sahel rainfall and Atlantic sea surface temperatures … show significant, concurrent relationships to the frequency, intensity and duration of Atlantic hurricanes.” (Source)

Dr. Neil Frank, former Director National Hurricane Center:

“Over the past several weeks numerous articles suggest Harvey and Irma were the result of global warming. The concept is a warmer earth will generate stronger and wetter hurricanes. A number of people have said Irma was the most intense hurricane in the history of the Atlantic while Harvey was the wettest and both were good examples of what we can expect in the future because of global warming. What does a fact check reveal about these two hurricanes?”

Frank shows that neither of the above contentions is true, read more.

See also:

Houston’s long history of flooding

Evidence that CO2 emissions do not intensify the greenhouse effect

An examination of the relationship between temperature and carbon dioxide

A Simple Question for Climate Alarmists

No Atlantic hurricanes so far this season – a half time report

“Predictions are hard, especially about the future.”  Just ask NOAA.  Last May they published this forecast for the 2013 Atlantic hurricane season:

“For the six-month hurricane season, which begins June 1, NOAA’s Atlantic Hurricane Season Outlook says there is a 70 percent likelihood of 13 to 20 named storms (winds of 39 mph or higher), of which 7 to 11 could become hurricanes (winds of 74 mph or higher), including 3 to 6 major hurricanes (Category 3, 4 or 5; winds of 111 mph or higher).  These ranges are well above the seasonal average of 12 named storms, 6 hurricanes and 3 major hurricanes.”

The score so far, at half time, is six tropical storms and no hurricanes as of this writing.  But the season is not over.  NOAA says the season usually peaks around September 10, and we still have three months to go.

Back in May NOAA boasted: “New for this hurricane season are improvements to forecast models, data gathering, and the National Hurricane Center communication procedure for post-tropical cyclones. In July, NOAA plans to bring online a new supercomputer that will run an upgraded Hurricane Weather Research and Forecasting (HWRF) model that provides significantly enhanced depiction of storm structure and improved storm intensity forecast guidance.”

On August 8, NOAA gave an update: NOAA “continues to call for an above-normal season, with the possibility that the season could be very active. The outlook indicates a 70% chance of an above-normal season, a 25% chance of a near-normal season, and only a 5% chance for a below-normal season.”  They base this prediction on “above-average sea surface temperatures in the MDR (main development region) and to an enhanced west African monsoon, both of which are now in place.”

According to climate alarmists, global warming should produce more hurricanes, but real data show a declining trend since 1998:

Global-Hurricanes-2013-August


Yes, “Predictions are hard, especially about the future.” We will just have to wait to see how the second half plays out.

UPDATE: On September 11, tropical storm Humberto officially became a hurricane with sustained winds of 80 mph.  It was centered about 340 miles (550 kilometers) west of the southernmost Cape Verde Islands and was moving north at 9 mph (15 kph).

Hurricane Sandy in perspective

As I write, Hurricane Sandy is making its way through New Jersey and New York wreaking havoc. Some of the press is claiming this “Frankenstorm” is a result of global warming. Some proponents of anthropogenic global warming (AGW) claim that hurricanes will become either more frequent or more intense as the planet warms.

Let’s look at some real data from Dr. Ryan Maue (http://policlimate.com/tropical/ ).

First, we see that hurricane frequency is not increasing:

Maue-Hurricane-frequency

Next, we drop down the energy scale a bit to include tropical storms and see that they, as well as hurricanes are not becoming more frequent.

Maue-tropical-storm-and-hurricane-frequency

Finally, we look at storm intensity and see that although this is quite variable, there is no overall trend:

Maue-tropical-cyclone-energy

From these data we see that hurricanes fail to follow the AGW predictions. So, either AGW alarmists are wrong or there is no recent global warming.

Is Sandy unprecedented? No, but it is unusually strong and widespread because of the confluence of a hurricane with a major cold front from the north.

Sandy made landfall in New Jersey, so look at the history of such hurricanes from “Hurricanes and the Middle Atlantic States.” That source provides brief descriptions of 21 hurricanes that affected New Jersey between 1821 and 2011. That list includes Hurricane Hazel on October 15, 1954. So even October hurricanes are not unprecedented.

Dr. Judith Curry, in a very long assessment of lessons learned since Hurricane Katrina in 2005, notes that there is still uncertainty of exact causes of frequency and intensity. But, the Pacific Decadal Oscillation (PDO) and the North Pacific Gyre Oscillation (NPGO) have dominant impacts on hurricane variability in the Pacific, and modulates the frequencies of El Nino/La Nina. Curry says, “I suspect that the combination of the PDO and NPGO can explain much of the variability in Ryan Maue’s analysis of Accumulated Cyclone Energy diagram, given that the majority of global hurricanes occur in the Pacific.” “In the Atlantic, the Atlantic Multidecadal Oscillation (AMO), the North Atlantic Oscillation (NAO), and Atlantic Meridional Mode (AMM) have all been invoked to explain variability in the Atlantic …”

Although the science of exact attribution is not settled, it does seem that AGW is not the answer since natural variability provides an explanation.

See also:

IPCC says they don’t know if the climate is becoming more extreme

Weather extremes and global warming – no increasing trend

IPCC says they don’t know if the climate is becoming more extreme

There has been much speculation and many headlines about the relationship between global warming and extreme weather.  For example, see this recent alarmist story from the AP in the Arizona Daily Star: “World warned to prepare for extreme weather.”  The first line of that story says, “Global warming is leading to such severe storms, droughts and heat waves that nations should prepare for an unprecedented onslaught of deadly and costly weather disasters, an international panel of climate scientists said in a new report issued Wednesday.”  Apparently the story authors got their information from alarmist press releases and interviews rather than the report itself.  (They got the page count wrong too.)

The basic conclusion of the Intergovernmental Panel on Climate Change’s (IPCC) new report on the subject of extreme weather is: “While there is evidence that increases in greenhouse gases have likely caused changes in some types of extremes, there is no simple answer to the question of whether the climate, in general, has become more or less extreme.”

While storm damage makes the news, the damage is largely an artifact of our propensity for building infrastructure in the areas subject to extreme weather rather than any imagined increase in such weather.

IPCC: “There is medium evidence and high agreement that long-term trends in normalized losses have not been attributed to natural or anthropogenic climate change.”

Some other interesting quotes from the IPCC report:

“The statement about the absence of trends in impacts attributable to natural or anthropogenic climate change holds for tropical and extratropical storms and tornados.”

“The absence of an attributable climate change signal in losses also holds for flood losses.”

“Some authors suggest that a (natural or anthropogenic) climate change signal can be found in the records of disaster losses (e.g., Mills, 2005; Höppe and Grimm, 2009), but their work is in the nature of reviews and commentary rather than empirical research.”

You can download the 582-page report here: http://www.ipcc-wg2.gov/SREX/  That page allows you to download either the Summary for Policy Makers (11.8 Mb) or the full report (44 Mb).

See also:

The Storm Over Tornadoes

Media pawns in IPCC extreme weather hype

Pained Earth’s summer to forget: the rest of the story

Hurricanes and Global Warming

The press often prints dire predictions of the consequences of global warming when reporting damage from land-falling hurricanes. (For instance see stories here, and here, and here, and here) and some insurance companies are raising their rates (see here.)       However, the increased storm damage is an artifact of our tendency to build more stuff in the historical path of storms rather than an increase in storm frequency or intensity.

A new paper takes a look at hurricane frequency: Historical global tropical cyclone landfalls, Jessica Weinkle, Ryan Maue and Roger Pielke, Jr., Journal of Climate (in press).  They present the following graph:

Global-cyclone-frequency

You can see that in the last 40 years there has been no increase in hurricane landfalls.  The paper abstract reads:

In recent decades, economic damage from tropical cyclones (TCs) around the world has increased dramatically. Scientific literature published to date finds that the increase in losses can be explained entirely by societal changes (such as increasing wealth, structures, population, etc) in locations prone to tropical cyclone landfalls, rather than by changes in annual storm frequency or intensity. However, no homogenized dataset of global tropical cyclone landfalls has been created that might serve as a consistency check for such economic normalization studies. Using currently available historical TC best-track records, we have constructed a global database focused on hurricane-force strength landfalls. Our analysis does not indicate significant long-period global or individual basin trends in the frequency or intensity of land falling TCs of minor or major hurricane strength. This evidence provides strong support for the conclusion that increasing damage around the world during the past several decades can be explained entirely by increasing wealth in locations prone to TC landfalls, which adds confidence to the fidelity of economic normalization analyses.

The paper above speaks of land falling hurricanes.  The total number of detected hurricanes, land falling or not is also not increasing.  (Maue, R. N. (2011), Recent historically low global tropical cyclone activity. , Geophys. Res. Letts. VOL. 38, L14803, 6 PP., 2011).

The intensity of hurricanes is also not increasing as the planet warms.

Global-cyclone-intensity

Dr. Christopher W. Landsea, the Science and Operations Officer at the National Weather Service’s National Hurricane Center in Miami, FL., explains the relationship between global warming and hurricanes as follows:

Hurricanes are natural heat engines. They extract energy from the moist, warm air over the tropical and subtropical oceans, liberate this energy in the process of forming clouds and rainfall, but lose most of this energy in the cold exhaust of the cyclone in the upper part (~8 mi, or ~12 km) of the atmosphere. A very small percentage (less than 1%) of this released energy is used to warm the air within the hurricane, drop the air’s density and pressure, and cause the swirling winds to spin faster and faster.

It’s also important to point out that ocean temperatures are not the only factor that is crucial in knowing which disturbances will develop into a tropical storm and which systems will intensify to become extremely strong hurricanes. Other physical “ingredients” in the hurricane “recipe” include moist air and numerous thunderstorms, weak vertical wind shear (the difference in winds near the ocean versus the upper part of the atmosphere), and a triggering disturbance (in the Atlantic this is often from an African easterly wave in the atmosphere). All climate models predict that for every degree of warming at the ocean that the air temperature aloft will warm around twice as much. This is important because if global warming only affected the earth’s surface, then there would be much more energy available for hurricanes to tap into. But, instead, warming the upper atmosphere more than the surface along with some additional moisture near the ocean means that the energy available for hurricanes to access increases by just a slight amount. Moreover, the vertical wind shear is also supposed to increase, making it more difficult (not easier) for hurricanes to form and intensify.

The bottom line is that nearly all of the theoretical and computer modeling work suggest that hurricanes may be slightly stronger (by a few percent) by the end of the 21st Century, even presuming that a large global warming will occur.

Looks like another global warming scare story is not supported by facts.

Climate Model Projections vs Real World Observations


The Center for the Study of Carbon Dioxide and Global Change in Tempe, Arizona, has just issued a major report that compares projections from climate models to real world observations.

The report deals with the following climate model claims: “(1) unprecedented warming of the planet, (2) more frequent and severe floods and droughts, (3) more numerous and stronger hurricanes, (4) dangerous sea level rise, (5) more frequent and severe storms, (6) increased human mortality, (7) widespread plant and animal extinctions, (8) declining vegetative productivity, (9) deadly coral bleaching, and (10) a decimation of the planet’s marine life due to ocean acidification. And in conjunction with these analyses, we proffer our view of what the future may hold with respect to the climatic and biological consequences of the ongoing rise in the air’s CO2 content, concluding by providing an assessment of what we feel should be done about the situation.”

The 168-page report (2.5Mb) may be downloaded here.

“Real-world observations fail to confirm essentially all of the alarming predictions of significant increases in the frequency and severity of droughts, floods and hurricanes that climate models suggest should occur in response to a global warming of the magnitude that was experienced by the earth over the past two centuries as it gradually recovered from the much-lower-than-present temperatures characteristic of the depths of the Little Ice Age. And other observations have shown that the rising atmospheric CO2 concentrations associated with the development of the Industrial Revolution have actually been good for the planet, as they have significantly enhanced the plant productivity and vegetative water use efficiency of earth’s natural and agro-ecosystems, leading to a significant “greening of the earth.”

Hurricanes and Oil Slicks

In true Mencken style (“The whole aim of practical politics is to keep the populace alarmed by menacing it with an endless series of hobgoblins, all of them imaginary.” ) an AP story on the front page of the Arizona Daily Star speculates on dire consequences that may occur if a hurricane meets the oil slick in the Gulf of Mexico.

Here is what the National Oceanic and Atmospheric Administration (NOAA) says about such a possibility:

Most hurricanes span an enormous area of the ocean (200-300 miles) — far wider than the current size of the spill. If the slick remains small in comparison to a typical hurricane’s general environment and size, the anticipated impact on the hurricane would be minimal. The oil is not expected to appreciably affect either the intensity or the track of a fully developed tropical storm or hurricane. The oil slick would have little effect on the storm surge or near-shore wave heights.

The high winds and seas will mix and “weather” the oil which can help accelerate the biodegradation process. The high winds may distribute oil over a wider area, but it is difficult to model exactly where the oil may be transported. Movement of oil would depend greatly on the track of the hurricane. Storms’ surges may carry oil into the coastline and inland as far as the surge reaches. Debris resulting from the hurricane may be contaminated by oil from the Deepwater Horizon incident, but also from other oil releases that may occur during the storm. A hurricane’s winds rotate counter-clockwise. Thus, in very general terms: A hurricane passing to the west of the oil slick could drive oil to the coast. A hurricane passing to the east of the slick could drive the oil away from the coast. However, the details of the evolution of the storm, the track, the wind speed, the size, the forward motion and the intensity are all unknowns at this point and may alter this general statement.

Evaporation from the sea surface fuels tropical storms and hurricanes. Over relatively calm water (such as for a developing tropical depression or disturbance), in theory, an oil slick could suppress evaporation if the layer is thick enough, by not allowing contact of the water to the air. With less evaporation one might assume there would be less moisture available to fuel the hurricane and thus reduce its strength. However, except for immediately near the source, the slick is very patchy. At moderate wind speeds, such as those found in approaching tropical storms and hurricanes, a thin layer of oil such as is the case with the current slick (except in very limited areas near the well) would likely break into pools on the surface or mix as drops in the upper layers of the ocean. (The heaviest surface slicks, however, could re-coalesce at the surface after the storm passes.) This would allow much of the water to remain in touch with the overlying air and greatly reduce any effect the oil may have on evaporation. Therefore, the oil slick is not likely to have a significant impact on the hurricane.

All of the sampling to date shows that except near the leaking well, the subsurface dispersed oil is in parts per million levels or less. The hurricane will mix the waters of the Gulf and disperse the oil even further.

The experience from hurricanes Katrina and Rita (2005) was that oil released during the storms became very widely dispersed.

Besides NOAA, other sources say that storms disperse and/or bury oil already on the beach. Tar balls are common on Galveston Island beaches but less so after a storm. The Marshes should fare the same way. If anything, hurricanes have a tendency to leave beaches cleaner than they found them.

IPCC and Peer Review

The UN’s Intergovernmental Panel on Climate Change (IPCC) claims that all of its reports and predictions are based on strictly peer-reviewed scientific papers. Well, not exactly. Recent investigations have shown that many IPCC reports were based on everything from magazine articles, telephone conversations, and propaganda from radical environmental groups.

Mountain Ice

In its most recent report (the 2007 Fourth Assessment Report, aka 4AR), the IPCC stated that observed reductions in mountain ice in the Andes, Alps and Africa was being caused by global warming, citing two papers as the source of the information. However, one of the sources quoted was a feature article published in a popular magazine for climbers which was based on anecdotal evidence from mountaineers about the changes they were witnessing on the mountainsides around them. The other was a dissertation written by a geography student, studying for the equivalent of a master’s degree, at the University of Berne in Switzerland that quoted interviews with mountain guides in the Alps. See story in London Telegraph: http://tinyurl.com/y8ku7pm

Himalayan glaciers

The IPCC claim that Himalayan glaciers would melt by 2035 was based on an unverified magazine article and the IPCC knew it. Nevertheless, the IPCC let the statement stand for purely political purposes.

The claim that Himalayan glaciers are set to disappear by 2035 rests on two 1999 magazine interviews with glaciologist Syed Hasnain, which were then recycled without any further investigation in a 2005 report by the environmental campaign group World Wildlife Fund. This fact was brought to the attention of the IPCC before they published their 2007 report, but the IPCC let the statement stand. The original article was based on a short telephone interview with scientist Syed Hasnain, then based in Delhi, who has since said his views were “speculation”. The lead author of the IPCC chapter said, “We thought that if we can highlight it, it will impact policy-makers and politicians and encourage them to take some concrete action.” This alone shows that the IPCC is a political body rather than a scientific one. http://tinyurl.com/ydqa255

Amazon

The IPCC also made false predictions on the Amazon rain forests, referenced to a non peer-reviewed paper produced by an advocacy group working with the World Wildlife Fund. This time though, the claim made is not even supported by the report and seems to be a complete fabrication. See story at http://tinyurl.com/yc3c8xt

Floods and Hurricanes

The IPCC report wrongly linked global warming to an increase in the number and severity of natural disasters such as hurricanes and floods. The claims were based on an unpublished report that had not been subjected to routine scientific scrutiny – and ignored warnings from scientific advisers that the evidence supporting the link was too weak. The report’s own authors later withdrew the claim because they felt the evidence was not strong enough. The IPCC’s 2007 report contained a separate section that warned the world had “suffered rapidly rising costs due to extreme weather-related events since the 1970s”. This claim was touted by Obama last fall: “More powerful storms and floods threaten every continent.” http://tinyurl.com/yzef9en

Coral Degradation

In Chapter 6 of 4AR, the IPCC claims that coral degradation is caused by global warming. The source for this claim is promotional literature by Greenpeace. The IPCC also based reports on solar and wind power on Greenpeace documents.

See report: http://tinyurl.com/yk9mqhz

Implications for US climate policy:

The EPA based its carbon dioxide endangerment finding on the IPCC. The EPA is supposed to vet the peer-review process from outside sources of information, something it did not do, so the EPA did not comply with the law. See ClimateAudit analysis: http://tinyurl.com/yg78qof